Hedging Against Deflation
We like to think of deflation as a reduction in the amount of money and credit in the system. The price actions come as a consequence of this reduction. The credit part of the equation can be reduced by 1-repayment or 2-the debt being defaulted upon (a.k.a. restructured or forgiven). Both ways, the debt and credit has been reduced or extinguished. Assuming a decrease in demand for more debt, the overall amount of debt will naturally come down. This can have devastating effects on any investment portfolio so hedging against deflation with inverse ETFs should be considered by some investors.
What Sectors Will Get Hurt During Deflation?
Fixed income is, by definition, debt so any decrease in values in this sector will be deflationary. Looking at the bigger picture, we are coming off of a 30 year bull market in bonds. With record low rates and even negative interest rates in 2 of the 3 largest central banks, the chance of further increases in many classes of bonds, including asset backed securities and government bonds certainly, is questionable. They could get a little further negative but the risk/reward is terrible for owning bonds. So now is the time to prepare, before the tide turns and interest rates rise and credit quality falls.
High-Yield Bonds in Deflation
The most obvious things that will be severely impacted by debt defaults are securities with exactly those most likely TO default. In other words, those that begin with the lowest credit ratings, namely ‘junk bonds’. The issuance of high-yield bonds over the years has been nothing short of astounding and the demand for them downright scary. Many investors, of all types have ventured further out on the credit spectrum straining for extra yield. This is not only baby boomers or retirees but also institutions such as insurance companies, banks, endowment and pension funds.This is a by-product of persistently low interest rates.
Recall that in July 2007, right before the U.S. entered the Zero-Interest Rate Policy, ZIRP, the Fed Funds rate was 5.28% This is what we generally characterize as our ‘risk-free’ rate. It is the rate banks use to borrow from each other over the lowest time-frame, overnight. Amazingly, in 2014, the demand for junk bonds had gotten so intense that the average effective yield on junk bonds got driven down to just 5.16%, lower than the risk-free rate of just seven years prior.

That is both a fascinating and terrifying situation in one. It means that there are probably junk bond time bombs hidden throughout many portfolios, probably in your pensions, certainly backing your annuities and possibly in a target date fund in your 401k. That is a paltry amount to be paid for high-risk corporate bonds, especially considering that is a lower rate than the risk-free rate just seven years earlier. In other words, our collective complacency has allowed us to equate the risk of owning junk bonds to being essentially risk-free. Some fear junk bonds are the tip of the spear for the current bond bubble.
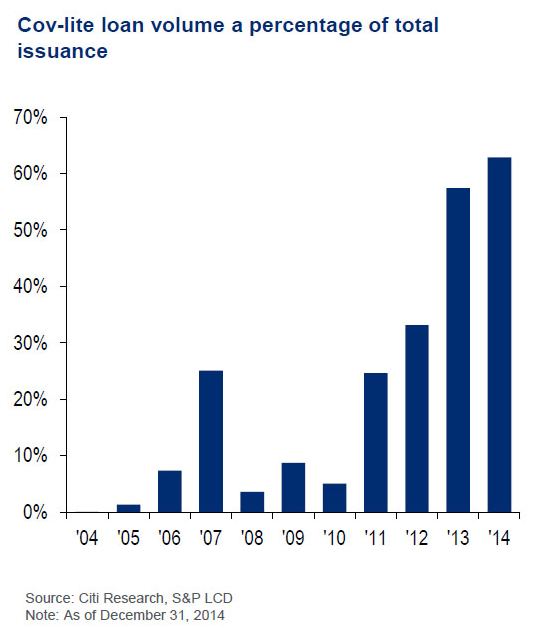
What’s even more worrisome, is these are not your grandfather’s high-yield bonds. They’re worse. Covenants in bond contracts are protection afforded to the lenders. They include things like caps on the amount of dividends a company can issue for shareholders or the amount of additional debt the company may take on. They are intended to be protection for the lenders. When a bond issue is said to be covenant-lite’ it simply means that the issue has a lesser amount of protection for the lender, for whatever reason. Prior to the financial crisis, in 2007, about one-quarter of all bonds had these riskier ‘covenant lite’ features, which at the time seemed very high. Fast forward to the end of 2014, see chart below created by Citigroup Research via Zerohedge, and that percentage had jumped to two-thirds. So investors are receiving record low yields for record low protection.
The most direct inverse bond ETF that would hedge against a collapse in junk bonds would be the ‘Short High Yield’ fund, SJB. There is also a hedged ETF, HYHG, which maintains a portfolio of high yield debt but minimizes the risk of rising interest rates with a hedge using U.S. Treasuries. We like this option better than the HYHG because we don’t think it will be interest rates that crush the junk bonds, but more the credit risk as they often move with equities. But we do think that interest rates will eventually rise so HYHG is better than owning junk bonds with no hedge at all. The best hedge against a junk bond portfolio might just be to not own any at all and have that portion of your portfolio in cash or a Treasury-only money market fund.
Real Estate in Deflation
As this amount of credit comes down, prices for almost everything come down, as most things are purchased, either directly or indirectly, with credit. Most prominently is, the price of real estate. The typical American mortgage buyer puts down 20% (and borrowing the other 80% presumably from a bank or mortgage originator), but many put just 5%, which is in fact encouraged by government sponsored organizations such as the FHA, Fannie Mae and Freddie Mac. Since home ownership has become synonymous with the American Dream, these policies have been widely solicited and adopted. If credit tightens up again you can expect U.S. home prices to tumble yet again, as well as ancillary businesses-construction, supplies, furnishings. What would a house cost if you had to put up 50% cash (like most investors in the stock market with Regulation-T requirements)? A lot less than today’s values. Prepare for the possibility.
Equity Markets in Deflation
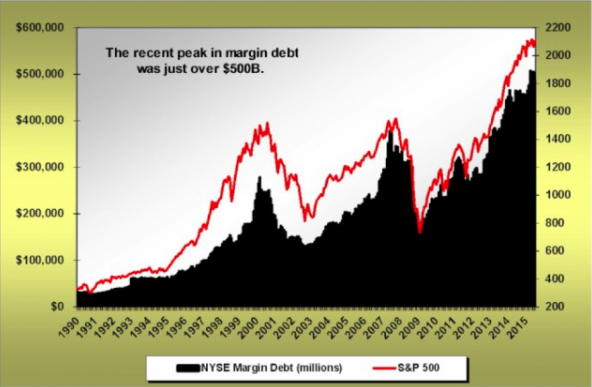
The deflationary collapse could also hit many sectors in the equity markets. Since credit is often extended to investors for the purchase of stocks, known as ‘margin lending’, equities, to the extent there is margin, are exposed. History shows that when excessive margin accompanies record breaking markets, the unwind can be brutal. Recall that from 2007-2009, the Dow Jones Industrial average lost 54% while in 2000-2002, the NASDAQ 100 bled almost 84%! In 2015, we hit a new record of margin debt recorded on the New York Stock Exchange of over $500 billion. To put this in perspective, that amount is higher than the 2007 peak in stocks at the real estate bubble and 82% higher than right before the dotcom bubble burst-an amazing and terrifying statistic. Here is a look at those numbers:
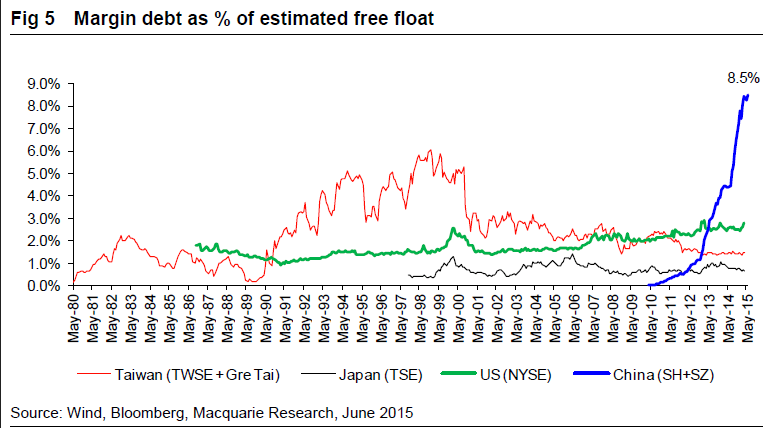
We’ve seen the extent to which excessive debt can cause swift market reversals in our markets. But to see how this translates internationally, look no further than China. Their stock markets dropped 35% of their value in a matter of weeks as margin debt unwound. Previously, their margin debt ballooned an unprecedented thirty-fold over the last three years. But it’s the margin size relative to the market’s size that caused such a collapse for the Chinese shares. According to a Wall Street Journal article, the amount of margin debt reached 8.5% of the markets estimated free float (the amount of shares actually trading on exchanges, not held by governments or corporate executives):
Financials
Of course many of the real estate loans end up on the balance sheets of financial companies, one way or another. The loans that aren’t packaged up and sold will remain on the books of banks. But many loans will be divided up and repackaged as collateralized securities including commercial sector (CMBS, CLOs, leveraged loans) and residential sector products (MBS). There has been a seven-fold increase in high leverage loans since 2013’ according to Kroll Bond Ratings, making leveraged loans especially worrisome. All of the securitized products have ended up on the balance sheets of many private equity companies, hedge funds, insurance companies as well as pension funds and endowments. You may notice that some of the segments of the financial markets exposed to deflation are the same that are exposed to rising interest rates and that’s because they go in hand. Rising interest rates will be a major headwind that exacerbates a deflationary trend. Inverse financial ETFs SEF, SKF and FAZ are single double and triple-levered exchange traded funds.
Hedging Against Deflation Using Inverse ETFs
At the end of the day, we doubt you can tackle a debt problem with more debt. If you fear the onset of deflation, hedging against any of the sectors above with inverse ETFs could mitigate some risk for your portfolio. Using the overextended indices listed above, there are inverse ETFs that track the opposite of the Nasdaq 100 and Dow Jones Industrials. ProShares has the Short QQQ (PSQ) tracks the inverse of the NASDAQ 100 and the Short Dow 30 (DOG) which aims to return the inverse of the Dow Jones Industrial average.
Hedging Against Deflation with these inverse ETFs:
- SJB
- DOG
- PSQ
- SEF
- SKF
- FAZ
Hedged ETFs Mentioned:
- HYHG